


Improvements in Campaign Reports
Improvements in Campaign Reports
Last update

We have completely redesigned the reports for regular campaigns and A/B campaigns. New structure, new logic of components, and more comprehensive metrics to understand the performance of each campaign at a glance.
Below we explain all the changes in detail.
Summary
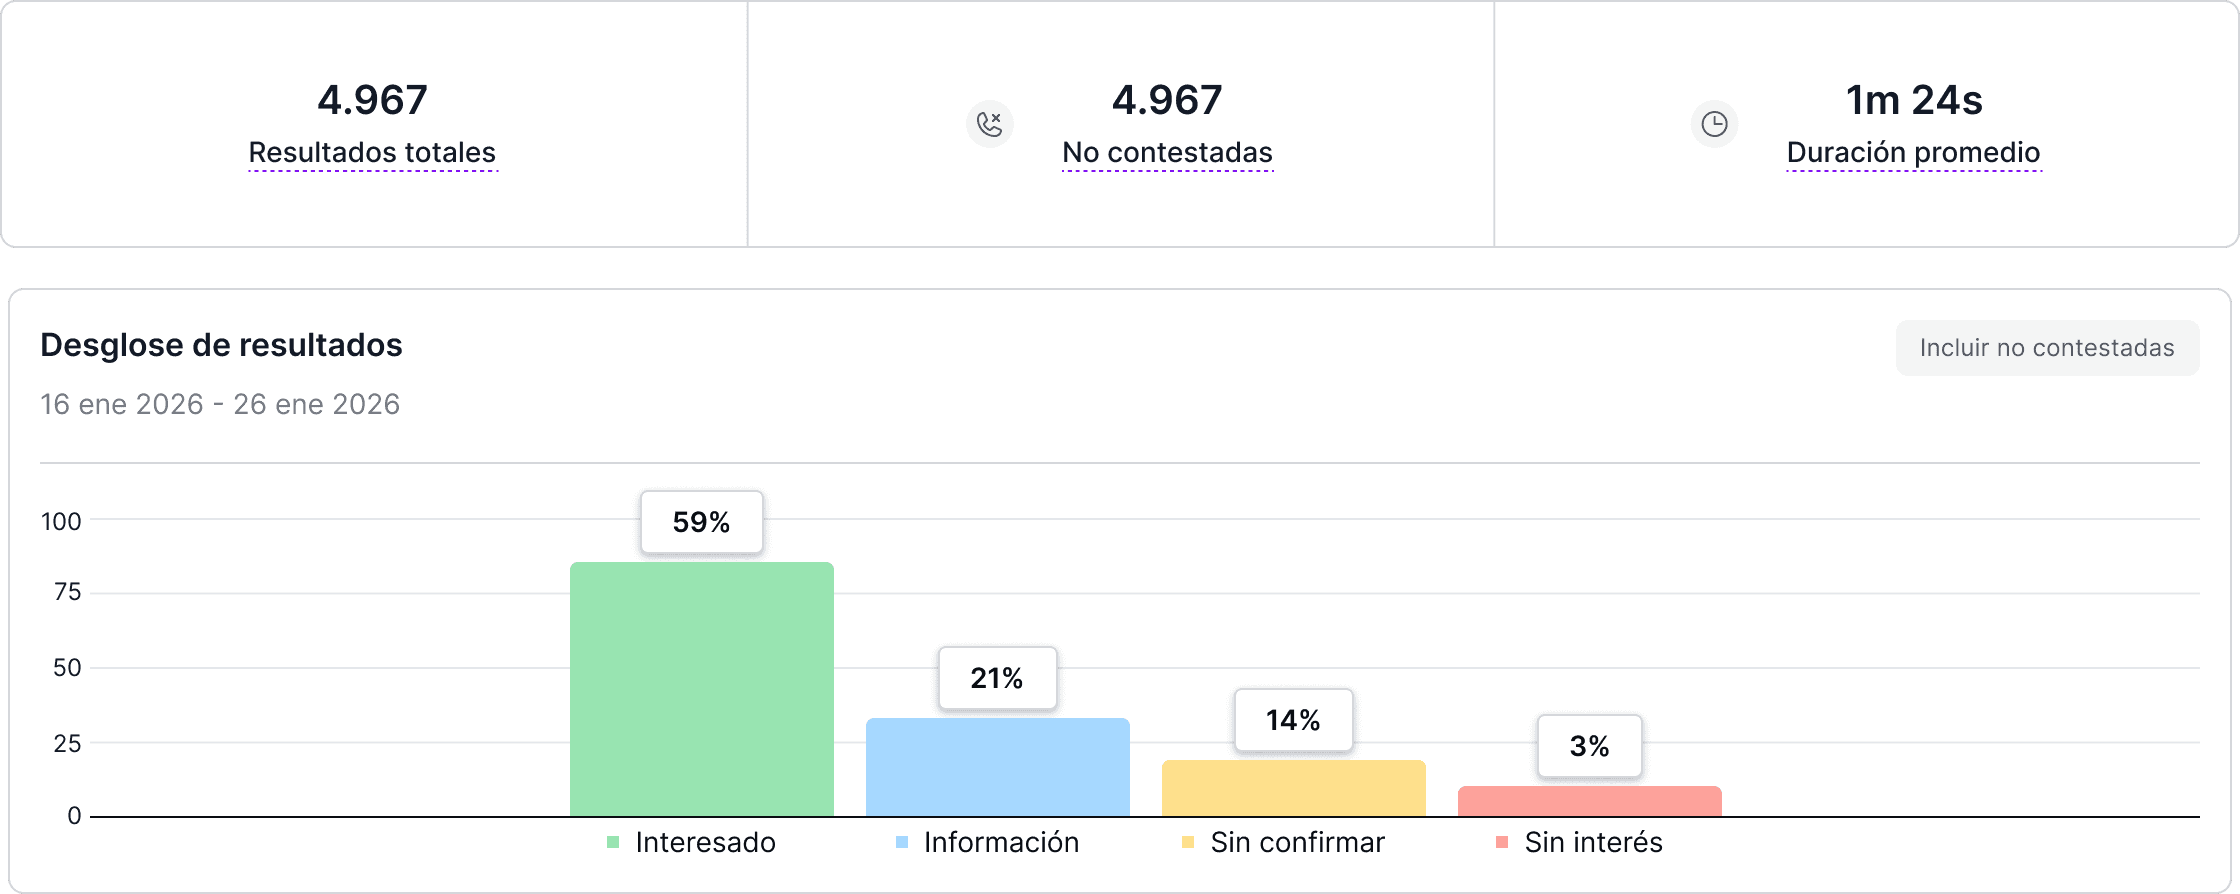
The Summary tab shows at a glance the most relevant indicators of your campaign: contacts reached, calls made, average duration, and cost of your campaign.

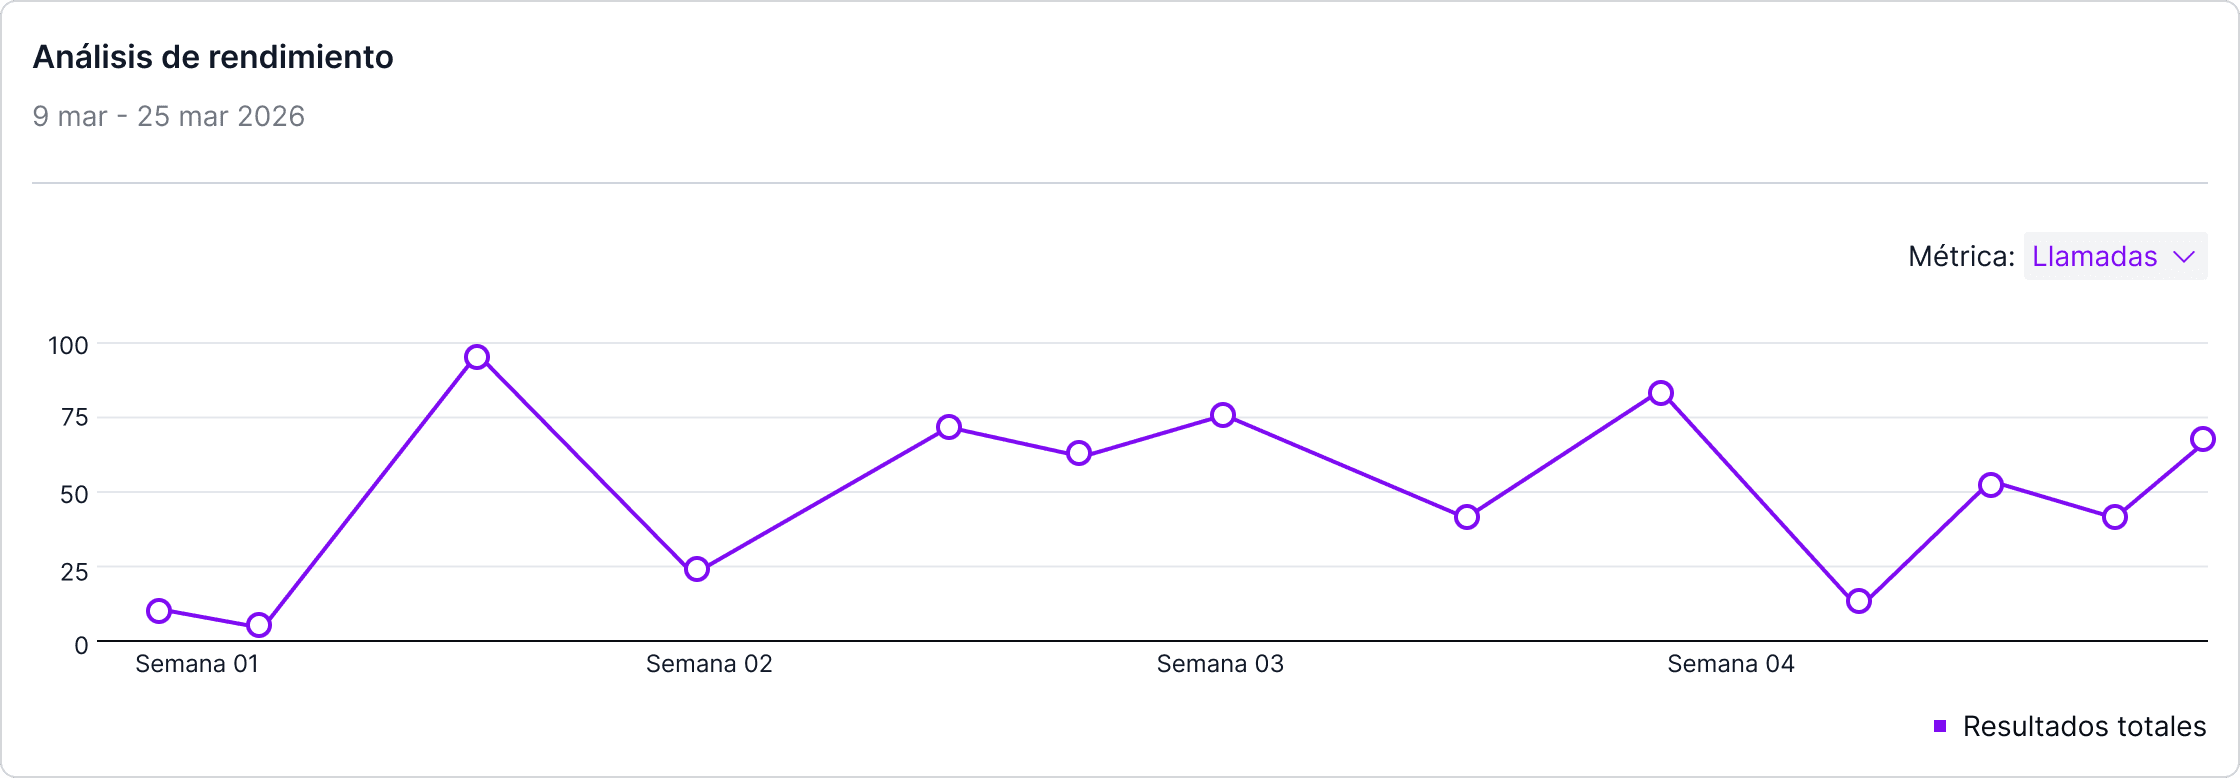
Below you will find a graph showing the evolution of your contacts, average duration, and calls from your campaign.
Results
The section is reorganized to facilitate analysis:
Breakdown of results: percentage distribution of each result, with the option to include unanswered calls
Results over time: evolution grouped by day, week, or month
Results table: details of volume, percentage, first attempt, and average time
It allows you to analyze the performance and efficiency of each result.
Evaluator (Ringr Call Evaluator)
The Evaluator (Ringr Call Evaluator) is integrated within the campaign report.
Includes:
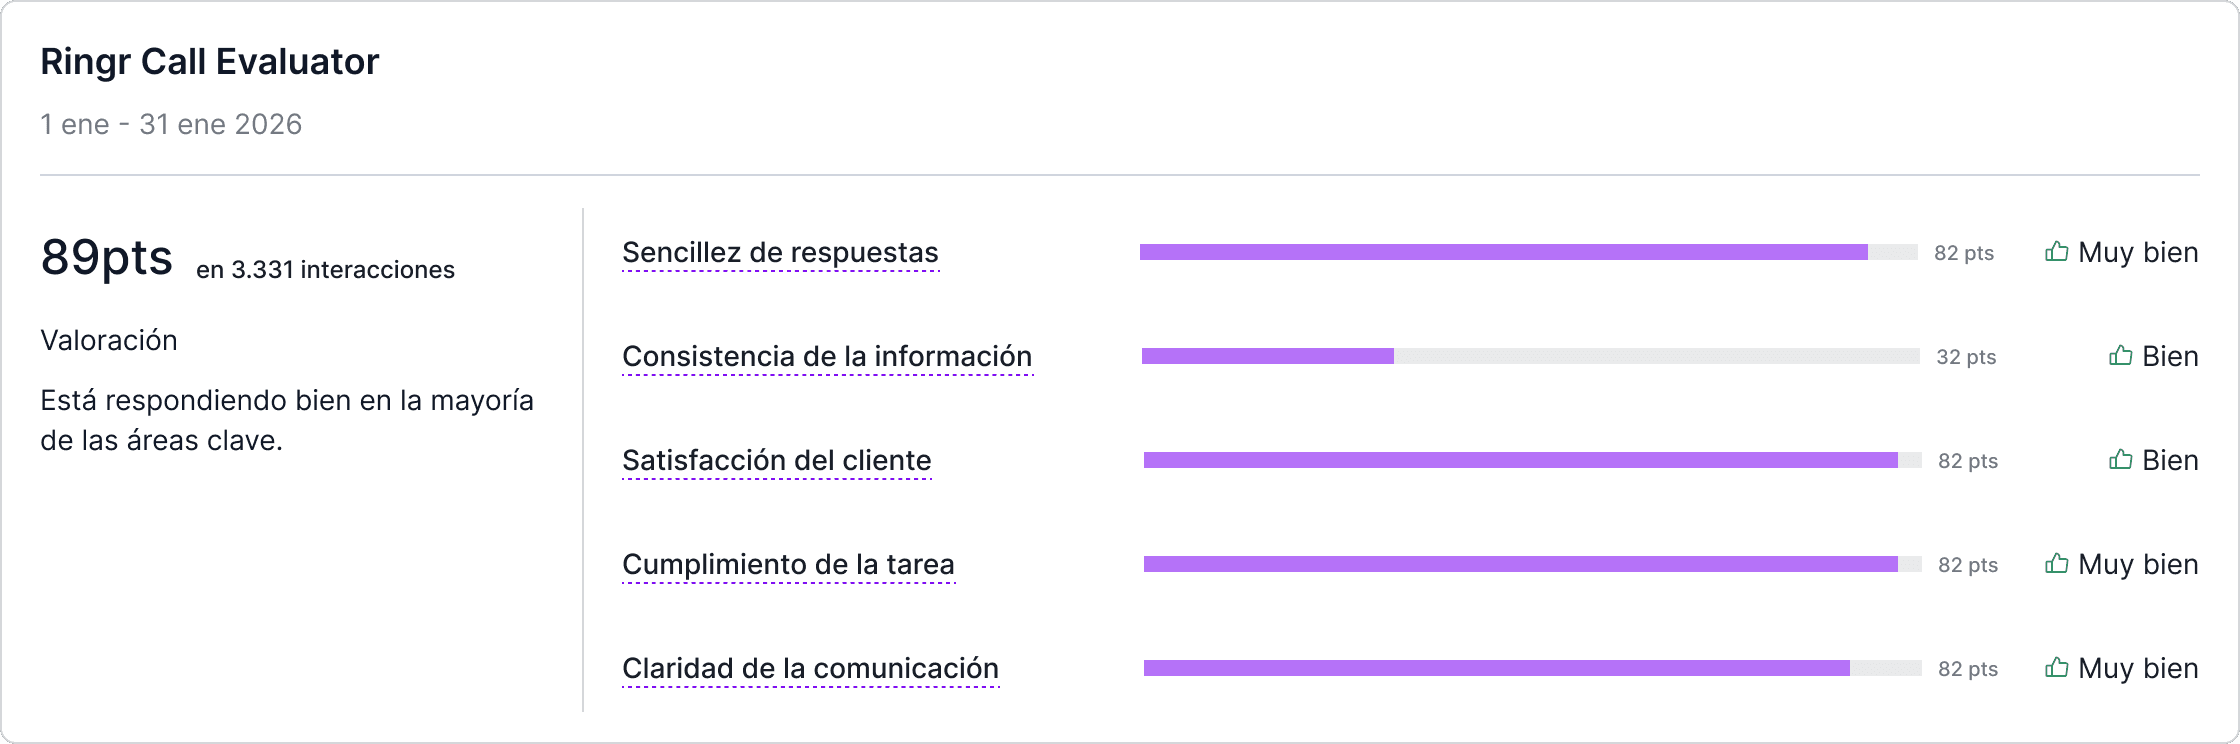
Overall evaluation
Shows the overall score of the campaign, accompanied by a valuation and the breakdown by areas: customer satisfaction, task completeness, response consistency, among others. Each area includes its individual score and a qualitative assessment.
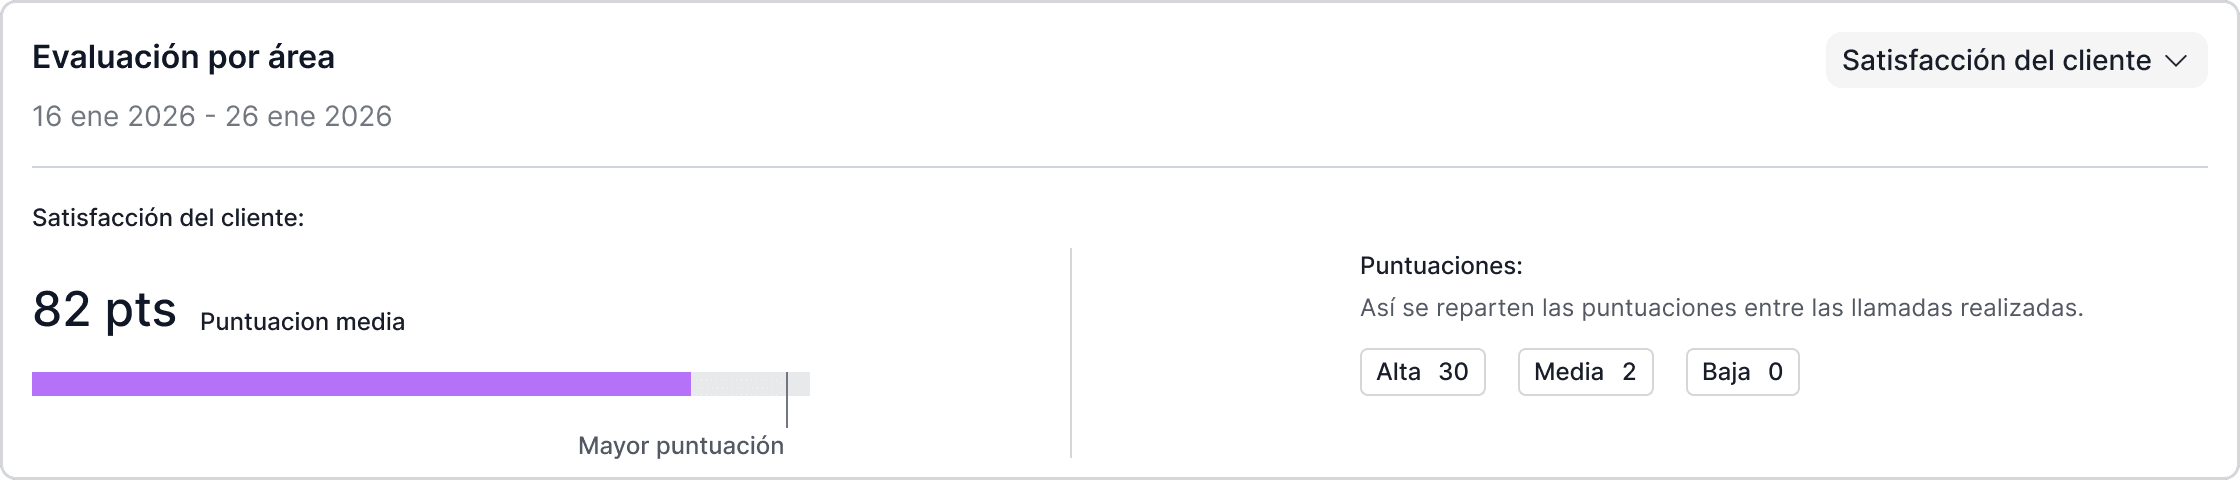
Evaluation by area
Allows you to delve into each criterion individually. You will see the average score of the area, the distribution bar, and the breakdown of calls by score range: high, medium, and low.
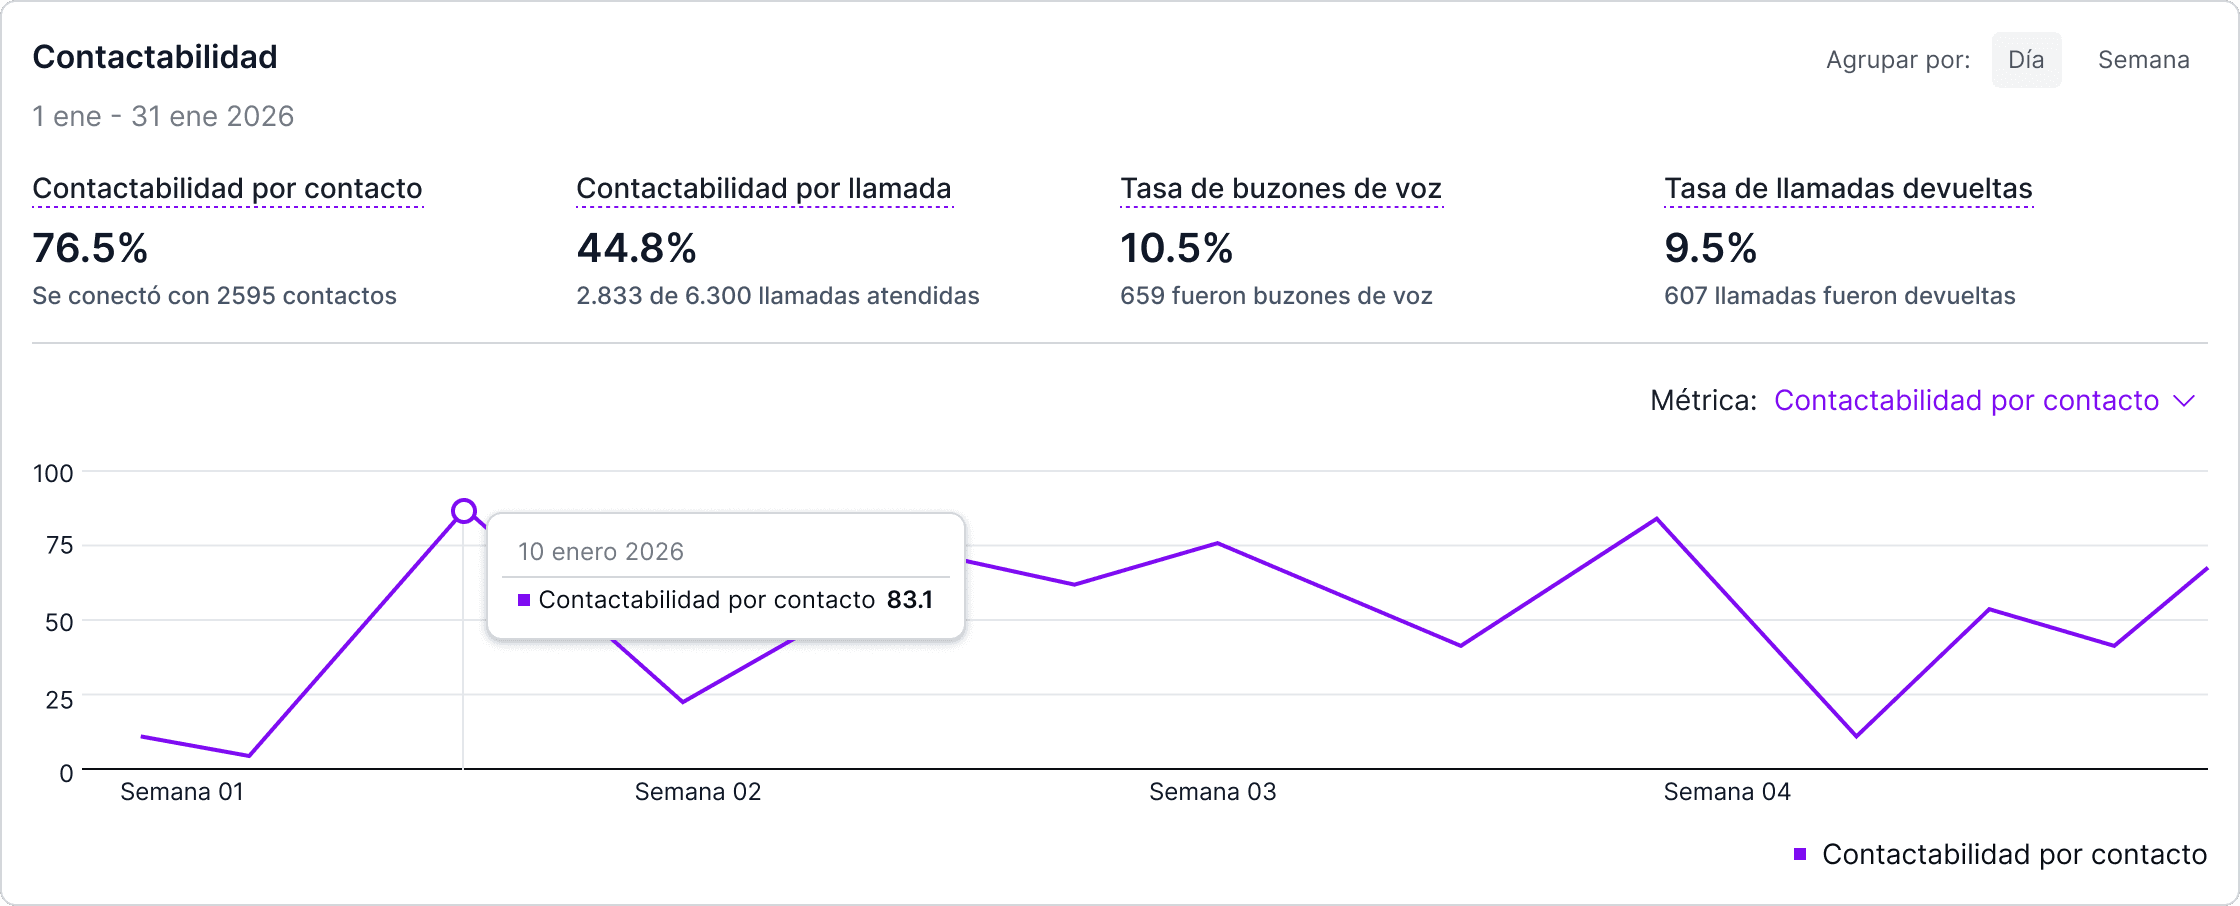
Contactability
A new section is added to measure the contactability capacity of the campaign:
Contactability by contact
Contactability by call
Voicemail rate
Returned call rate
Includes temporal evolution to analyze trends and patterns.
A/B Campaign Reports
A/B campaign reports have been redesigned to facilitate comparison between variants at two levels:
Overview
Concentrates all shared information between variants in one place. You will find the performance analysis with the key indicators of the A/B campaign, the breakdown of results, and a graph of results by variant that allows you to visually compare the weight of each result in each variant.
You will primarily be able to see:
KPIs of your campaign
Breakdown of results
Comparison of results by variant
Evaluator and Contactability by variant
Variant view:
Each variant includes the same level of detail as an individual campaign:
Summary
Results
Evaluator
Contactability
Only the fields that change between variants are shown, facilitating comparison.