


New Ringr Analytics Section
New Ringr Analytics Section
Last update

Unify all the key performance information of your agents in one place, with clear metrics, daily comparisons, and advanced analysis.
Daily Analytics
1.1 Total Calls (today vs. yesterday)
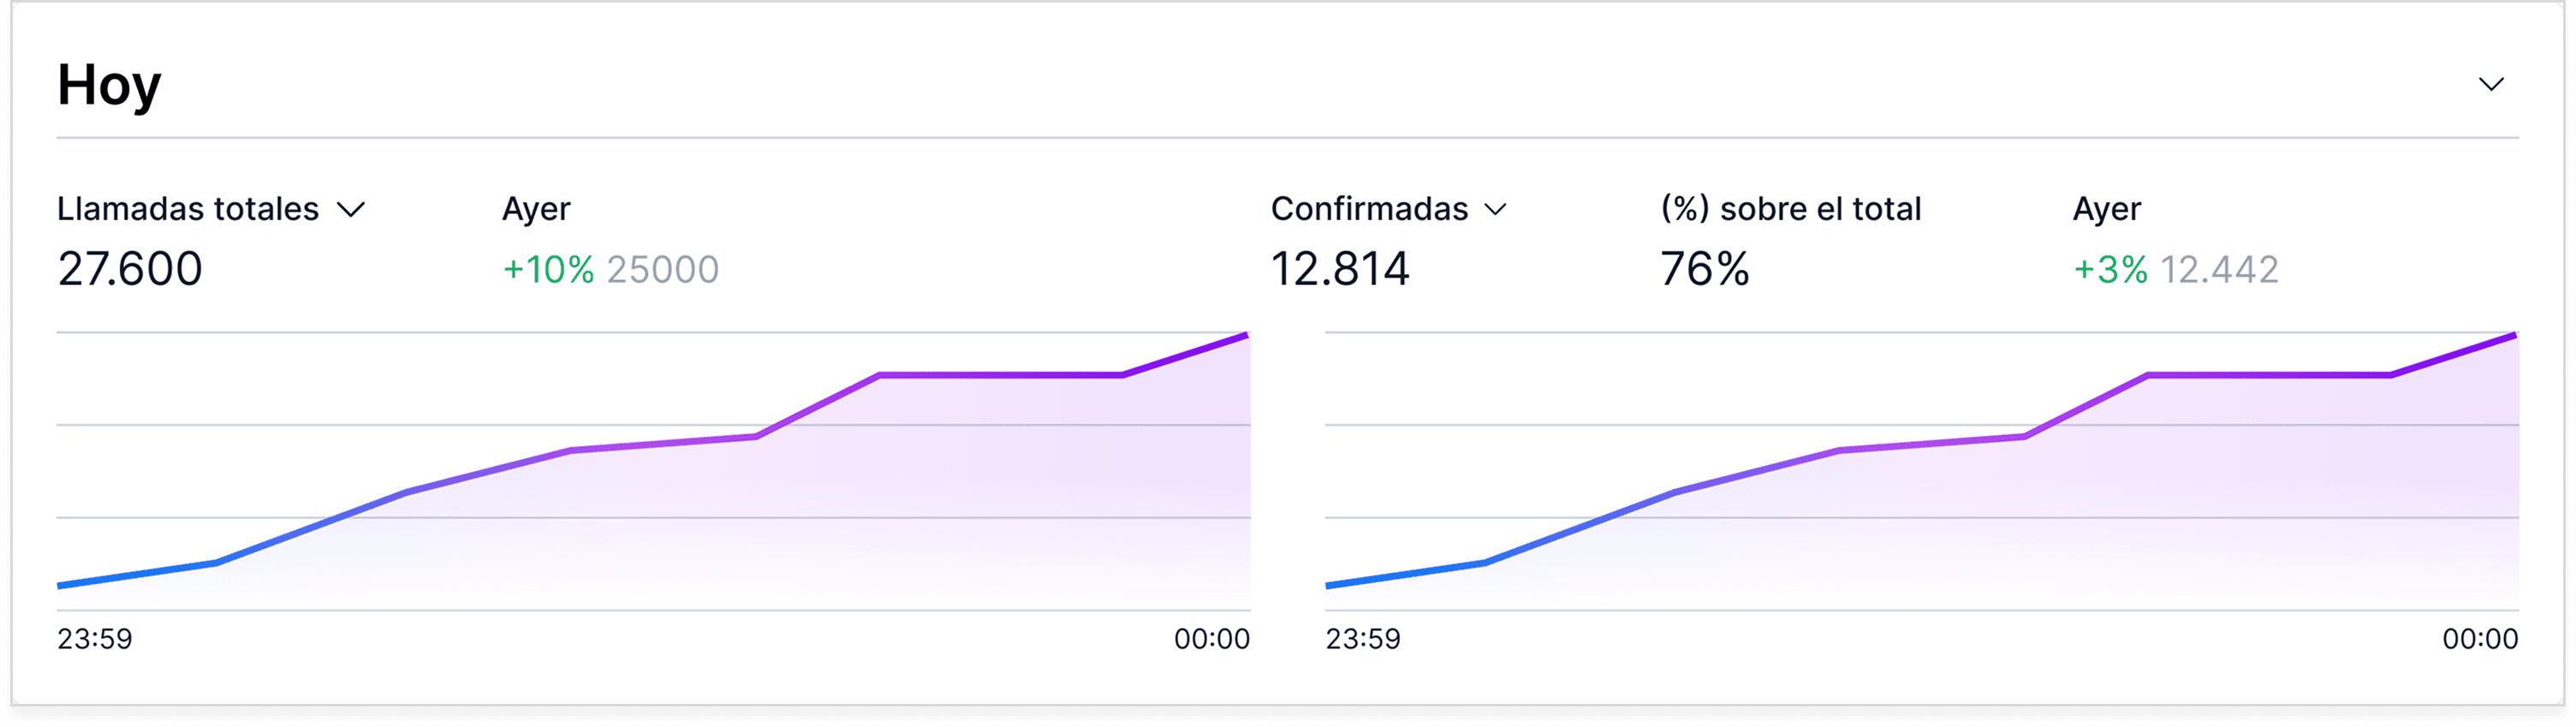
This section shows the total volume of calls made during the day and automatically compares it with the same period of the previous day. Thanks to the cumulative line, you can understand not only how many calls you have made but also how your operation is progressing throughout the day.
Includes:
The total number of calls today.
The percentage variation compared to yesterday (positive or negative).
A visual comparison using a cumulative curve that shows at what times traffic increases the most.
How to interpret the cumulative curve:
The curve grows progressively as the hours of the day advance.
If growth is faster at certain hours, it indicates moments of higher operational activity.
A flatter curve suggests periods with fewer generated calls.
1.2 Results by Tags (today vs yesterday)
In this section, you can see how the results of the calls are distributed throughout the day according to their tags (for example, payment commitment or payment rejected). Just like with total calls, we also show the comparison with the same period from yesterday, allowing you to understand if operational performance is improving or not.
Includes:
The total of the selected tag for the day (for example, “Confirmed”).
The percentage it represents of the total calls.
The variation compared to yesterday in number and percentage.
A cumulative curve that shows how that result evolves throughout the day.
Visual comparison with the curve from the previous day.
How to interpret the cumulative curve:
The curve shows the speed at which results of the selected type are generated.
Early growth indicates that results are being achieved quickly in the early hours of the day.
A curve lower than yesterday's may indicate a slower pace in that type of result.
General Analytics
2.1 Call Flow
This section shows a visual funnel that represents the complete operational flow of the calls, from the first attempt to the final result. Its purpose is to help you identify where contacts or calls are being lost in the process, and how each stage advances within your operation.
The flow has two versions depending on the type of Ringr:
Outbound Version
In outbound operations, the flow reflects how contacts progress from when the call is initiated until a result is obtained:
Contacts: All calls that Ringr attempts to make.
Reached contacts: Contacts who answered the call.
Informed contacts: Contacts who heard Ringr's initial greeting.
Results (tags): Here each conversation is classified according to its result, for example in deliveries:
Confirmed deliveries
Modified
Unconfirmed
Cancelled
Inbound Version
In inbound operations, the flow reflects the journey of the calls that the customer receives:
Received calls: Includes both successful and failed calls.
Informed calls: Calls that heard Ringr's initial greeting (more than 5 seconds).
Qualified calls: Calls that Ringr can manage correctly (without external errors, cuts, or network failures).
Resolved: Final result of the call after the interaction with the agent.
Key points of the flow:
What each column represents:
Each column indicates a specific stage of the call process. The relative width shows how many calls advance or are lost at each step.
Why it is critical:
Allows you to quickly identify where losses occur: if the drop is in reached, informed, qualified, or in the final results. It is especially useful for correcting operational problems, evaluating providers, optimizing schedules, or improving contact strategies.
In outbound: The flow focuses on how many contacts respond and advance towards a result.
• In inbound: The flow focuses on how many incoming calls Ringr can process, which arrive correctly, and which can be resolved.
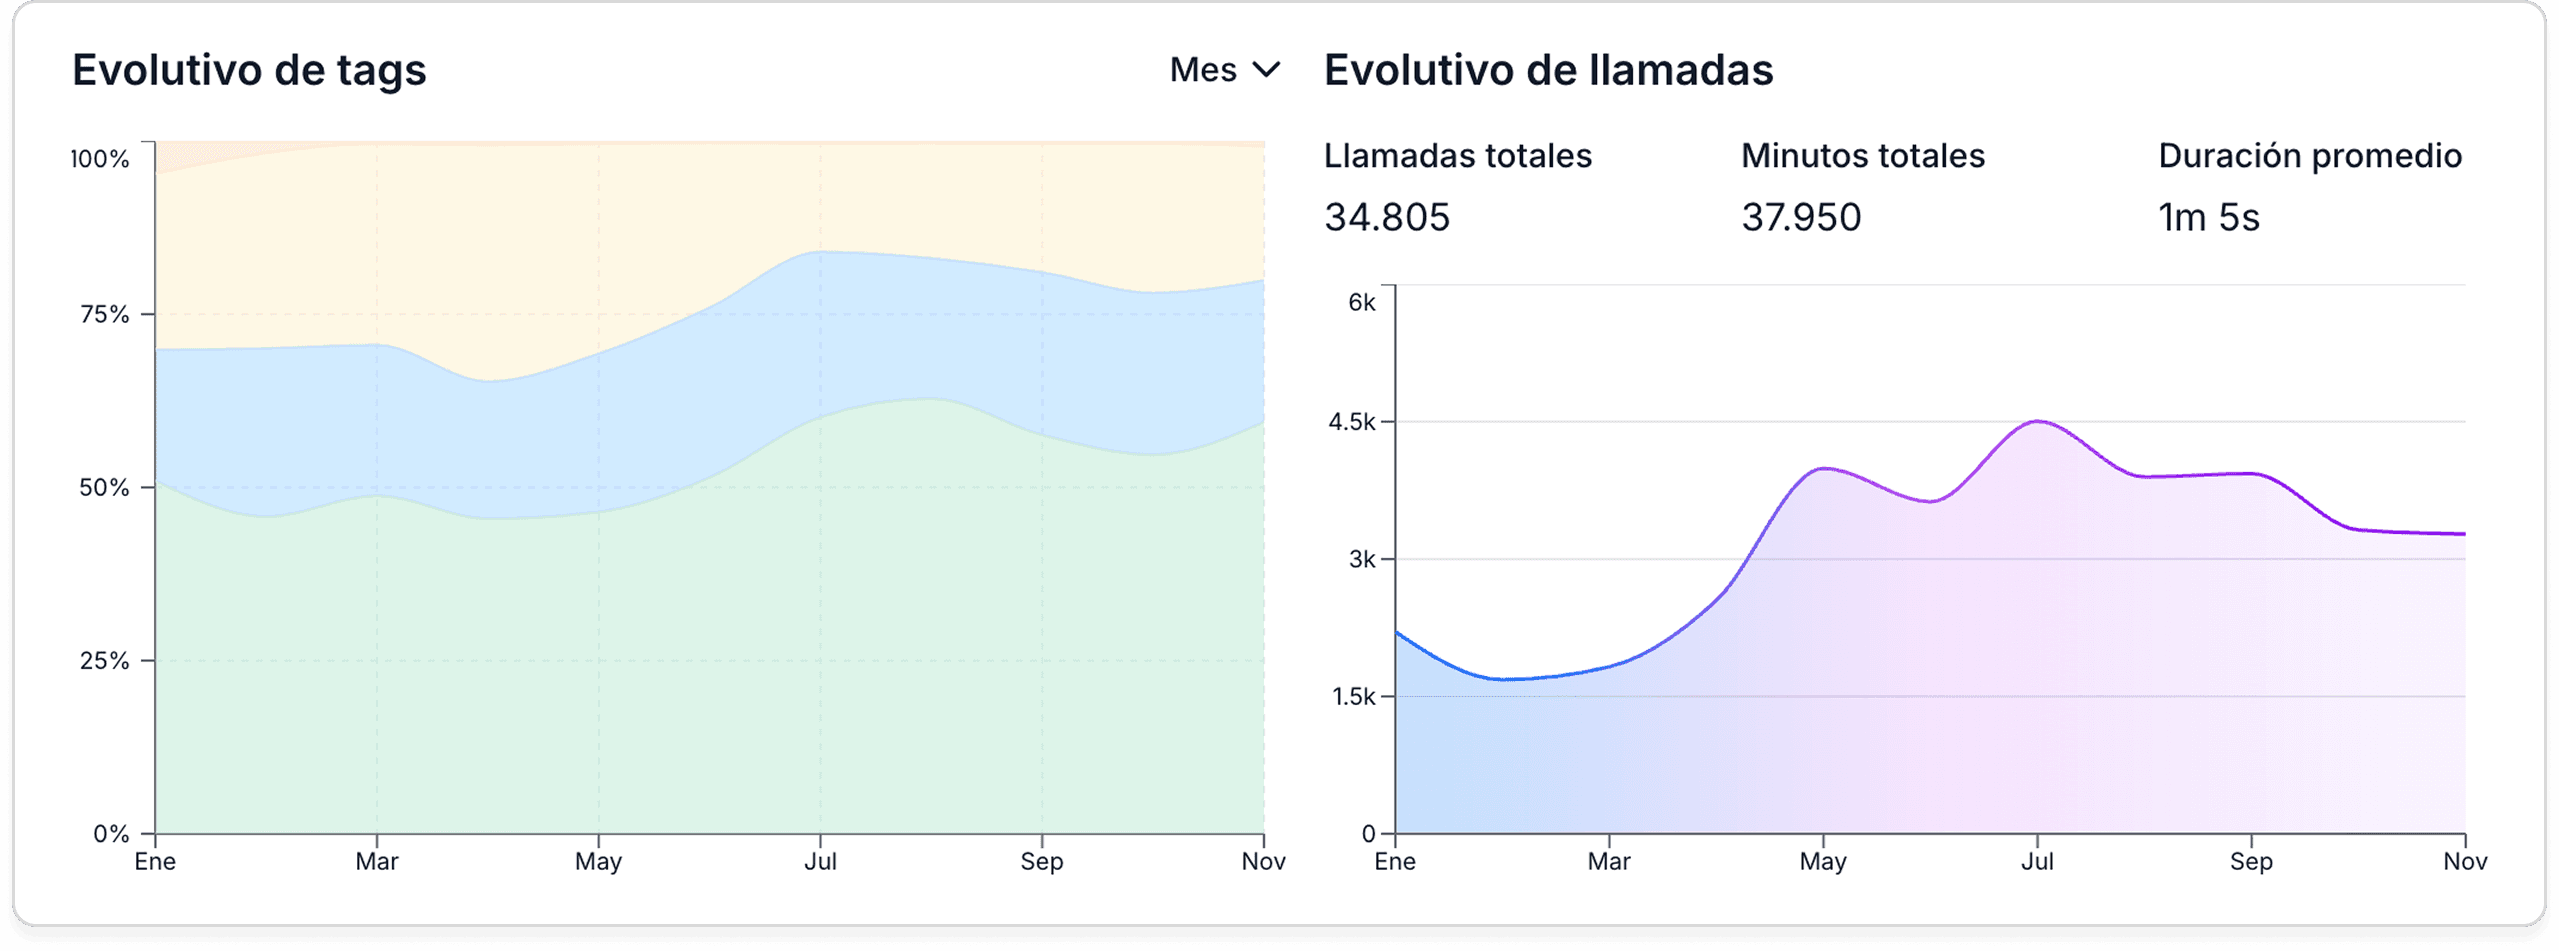
2.2 Tags Evolution
This section shows how the results of your calls change over time. Each call in Ringr has a tag assigned according to its result (for example: confirmed, modified, unconfirmed, cancelled), and this graph allows you to see the monthly distribution of each of those results.
The visual is shown in a stacked area chart, which makes it easier to understand what percentage each type of result represents within the total calls of each month. At a glance, you can identify trends, improvements, and changes in operational performance.
Includes:
Monthly distribution of all tags.
Cumulative percentages for each month.
Temporal evolution of each type of result.
Changes in proportions due to campaigns, script adjustments, or seasonal variations.
How to interpret this graph:
A wider area indicates that this tag represents a larger percentage of the total calls for the month.
If a result increases or decreases from one month to another, the graph reflects this immediately in the visual proportion.
Allows you to compare the stability or behavior of each type of result over time.
What insights can you gain:
Detect improvements in the confirmation rate.
Identify periods where unconfirmed calls increase.
See if changes in strategy, messages, or flows impact results.
Understand the "operational health" of your calls according to the actual evolution of your results.
2.3 Call Evolution (volume, minutes, and average duration)
This section shows how the activity of your calls evolves over the period you choose (days, weeks, or months). The goal is to give you a clear view of operational behavior over time, both in volume and total minute load, and average call duration.
Includes three key indicators:
Total calls: The total number of calls made during the selected period.
Total minutes: The sum of all minutes spoken by the agent during that same period.
Average duration: The average length of each call, calculated based on all conversations.
All this data is accompanied by a line chart, which shows how the number of calls varies over time, allowing you to detect patterns, peaks, or drops in activity.
Ringr Call Evaluator
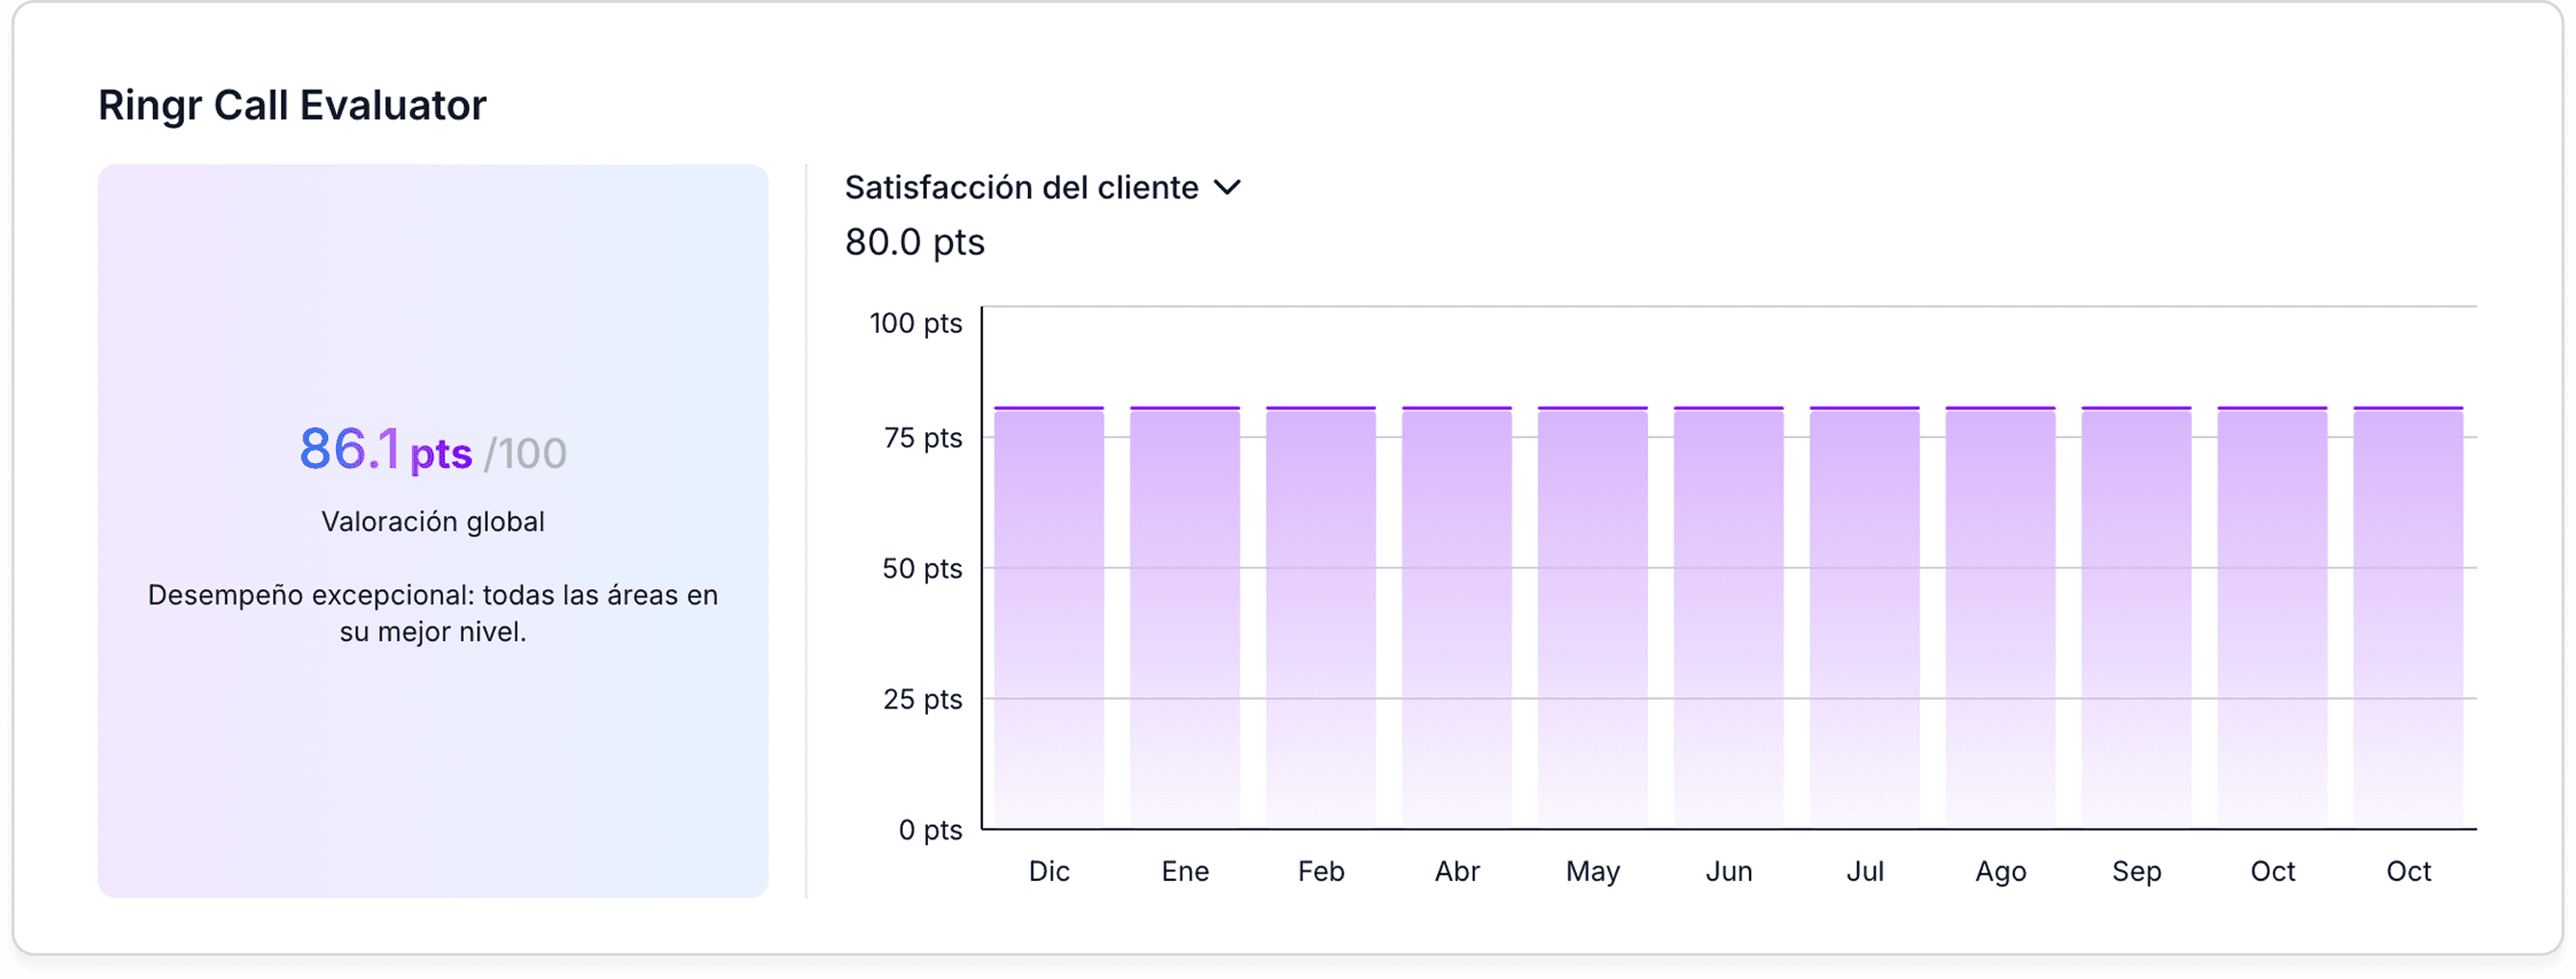
3.1 Overall Score (1–100)
The Ringr Call Evaluator is an agent that automatically analyzes the calls and generates an overall quality score between 1 and 100. This score summarizes the agent's overall performance on the call and allows you to quickly identify if the interaction was clear, effective, and aligned with objectives.
Includes:
An overall score for the entire selected period.
An overall average of all evaluated calls.
A visual indicator to understand if performance is improving or declining over time.
3.2 Key Evaluation Metrics
In addition to the overall score, the Call Evaluator breaks down quality into five fundamental dimensions. These metrics allow you to identify specific areas that may require adjustments or improvements.
The five dimensions are:
Consistency: Evaluates whether the agent follows stable behavior during the call, maintaining structure and coherence.
Customer Satisfaction: Indicates the level of perceived satisfaction based on tone, clarity, and effectiveness of the interaction.
Task Completion: Measures whether the agent successfully completed the objectives of the call (confirm, modify, inform, etc.).
Clarity: Observes whether the explanations were understandable, direct, and precise.
Simple: Evaluates whether the conversation avoided unnecessary complexity and whether the message was easy to follow.
How to interpret these metrics:
A high value in a dimension indicates that the agent excelled in that aspect during the selected period.
Low values help identify patterns: for example, low clarity may indicate a need to improve the script or prompts.
By analyzing all the metrics together, it is possible to obtain a complete vision of your agent's style and performance.
Exclusive Outbound Analytics
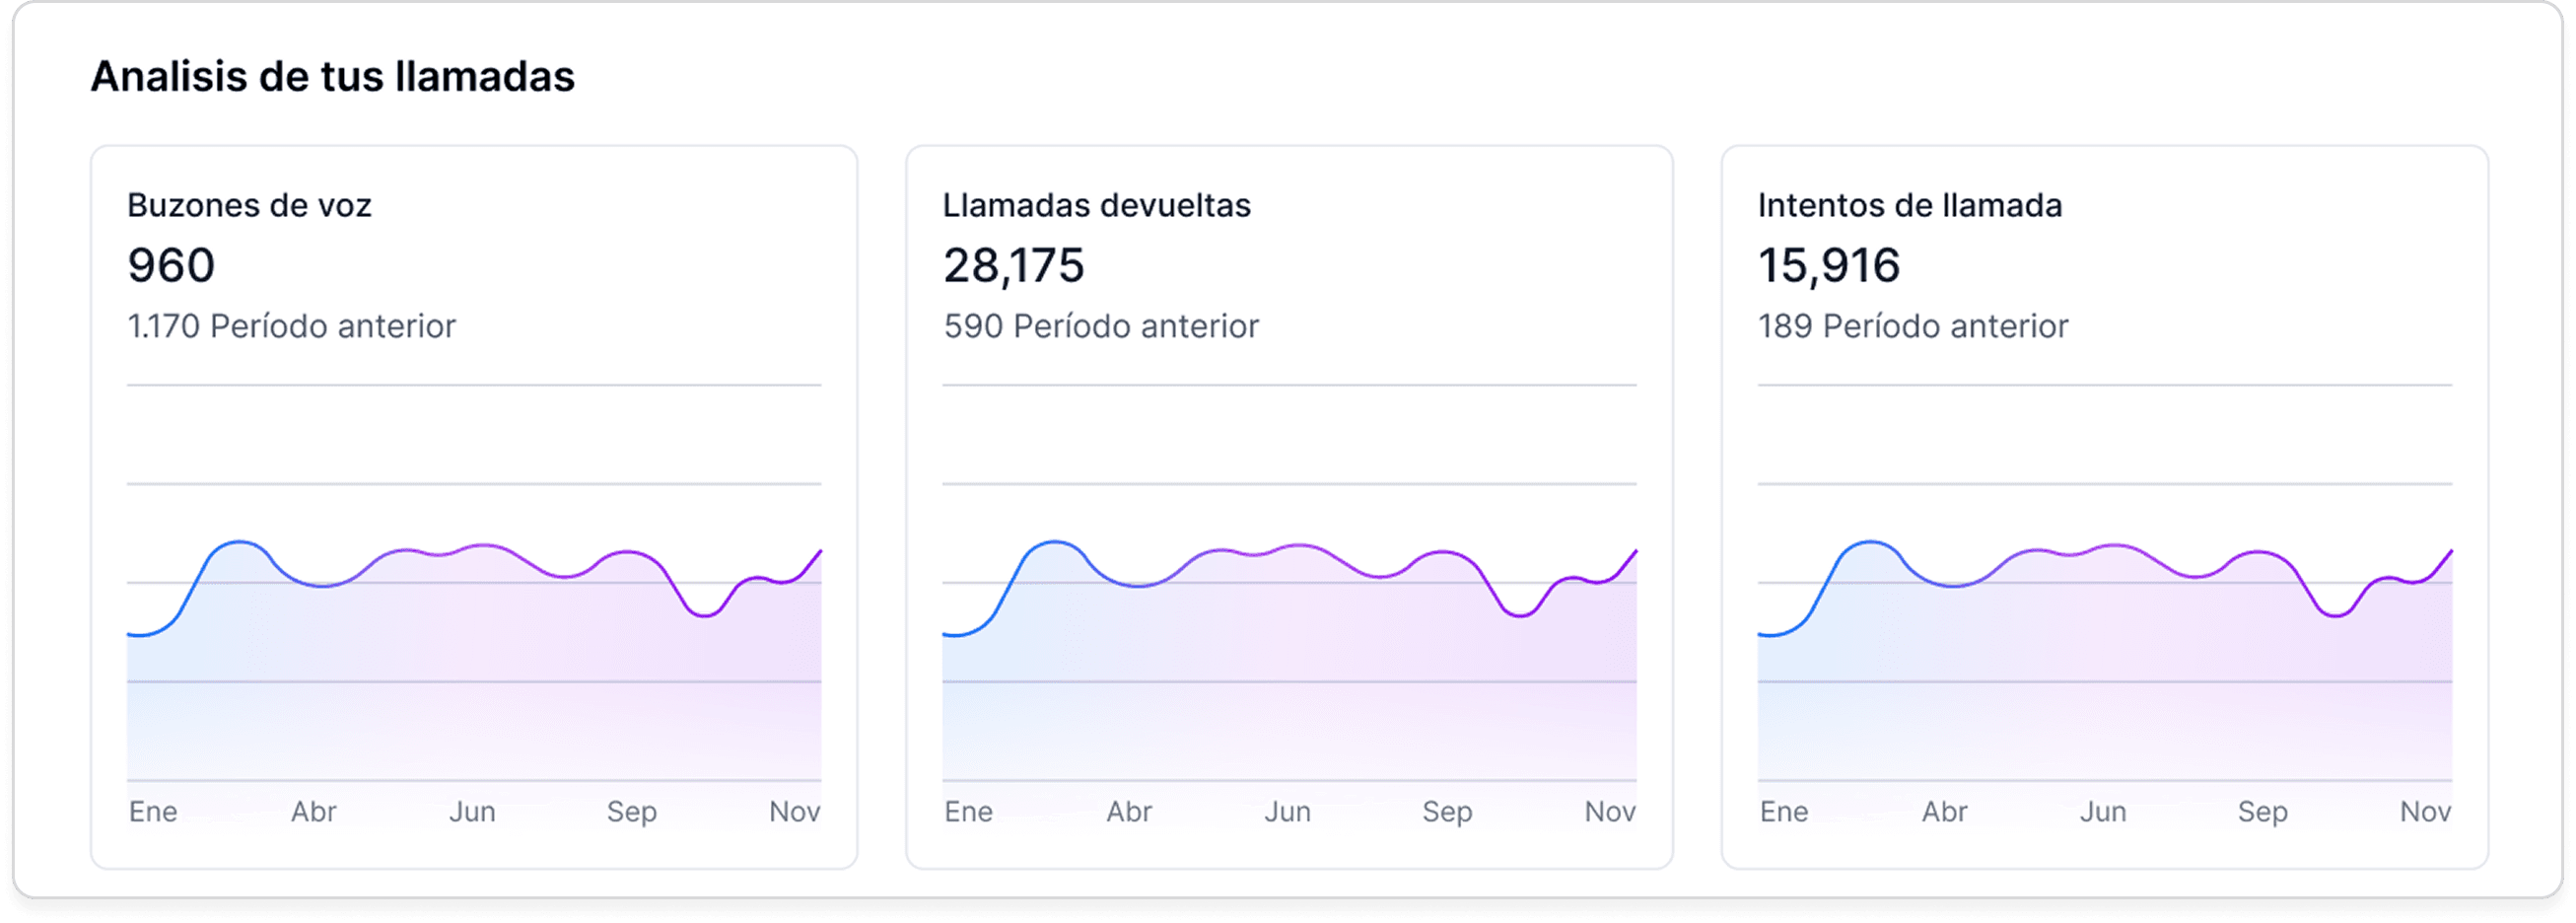
4.1 Voicemails, Returned Calls, and Call Attempts
In outbound call agents, not all calls behave the same: some end in voicemail, others are returned by the user, and others simply remain as attempts without contact.
This section allows you to see how each of these indicators evolves throughout the day, clearly and comparatively.
Here you can analyze:
Voicemails: How many calls are reaching voicemail. Ideal for evaluating the quality of the originating number, contactability hours, or potential anti-spam protections.
Returned Calls: How many people are returning the call to your Ringr agent.
Call Attempts: How many attempts your agent is making to contact a user before successfully or unsuccessfully achieving a conversation.